
There are as many methods of predicting electricity consumption as there are experts. Traditionally, experts provide the prediction model with various rules on how electricity consumption depends on temperature, time of day, season, days of the week, holidays, etc. With the traditional method, experts are well on the ball and are the masters of their own predictions. On the other hand, it is quite challenging to describe all the various factors that influence electricity consumption by unambiguous rules, especially if the phenomena are interdependent and complex, as real life is in general. Figure 1 below shows Finland’s electricity consumption in 2018.
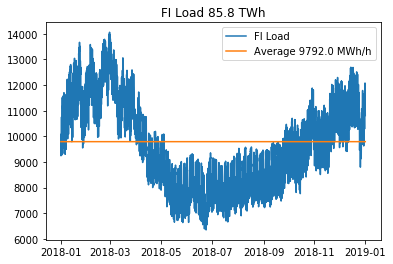
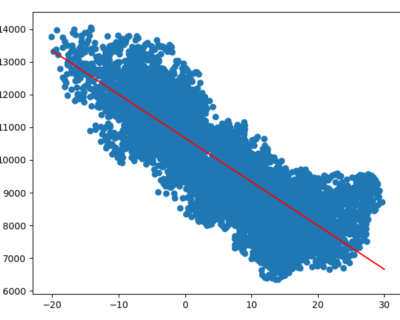
Figure 2 illustrates how Finland’s electricity consumption correlates with the temperature in one Finnish locality. The red line shows how temperature can be used to predict Finland’s electricity consumption, which is, on average, quite correct. There is a clear correlation between temperature and power consumption (0.68 to be exact), but most of the points are quite far away from the line. Producing a good prediction of consumption would require a number of such rules related to other explanatory factors.
What distinguishes artificial intelligence from traditional electricity consumption analysis? Can artificial intelligence beat experts?
With artificial intelligence, in turn, a machine is provided with a mass of data and allowed to tell the experts how electricity consumption depends on the data provided. The experts do not offer different rules; instead, artificial intelligence examines the data, teaches itself the rules, and predicts on that basis. Machine learning is able to describe even complex cause-and-effect relationships, but sometimes artificial intelligence can be way off the mark, and explaining the results is also often challenging.
The purpose of this test was to try proof-of-concept: whether it is possible to use electricity consumption time series from neighbouring countries to teach artificial intelligence to predict electricity consumption in Finland. The general trend is likely to be quite similar to that in Finland. If Finland is experiencing a peak in cold winter weather with high electricity consumption, the same is probably also true for neighbouring Sweden and Estonia. If, in turn, it is warm in the summer in Sweden and Estonia with low consumption, the same is likely to be happening in Finland as well. When people wake up in Sweden on a weekday morning to go to work and turn on the lights, the same is also happening in Finland. When there is a holiday in Sweden, that is frequently also the case in Finland. So could it be possible to predict electricity consumption in Finland using only the electricity consumption of neighbouring countries? There are many “buts” and “maybes” here, but let’s try!
Some of you might raise their eyebrows now, how do we know the consumption time series of our neighbours beforehand? You are correct, we don’t. The test is an example of many to show what could be possible with the help of machine learning. For the sake of simplicity, the example provided here is actually not forecasting future demand but showing how well we can predict historical values. However, from method perspective it does not make a difference. Artificial intelligence does not know if we are predicting the past or the future and it works the same way in both applications. The only thing that differs is what input data you can give the model and it will still teach itself based on the data given.
Support Vector Machines machine learning method tested
There are many different artificial intelligence methods as well. This test used a Support Vector Machines machine learning method, which I will call artificial intelligence for brevity. The method is openly available in Python’s sklearn package (SVR). What makes the method good for this purpose is that it also recognises the different interdependencies between all the various time series. For example, when consumption is high in Sweden and low in Estonia, what is its relationship to consumption in Finland?
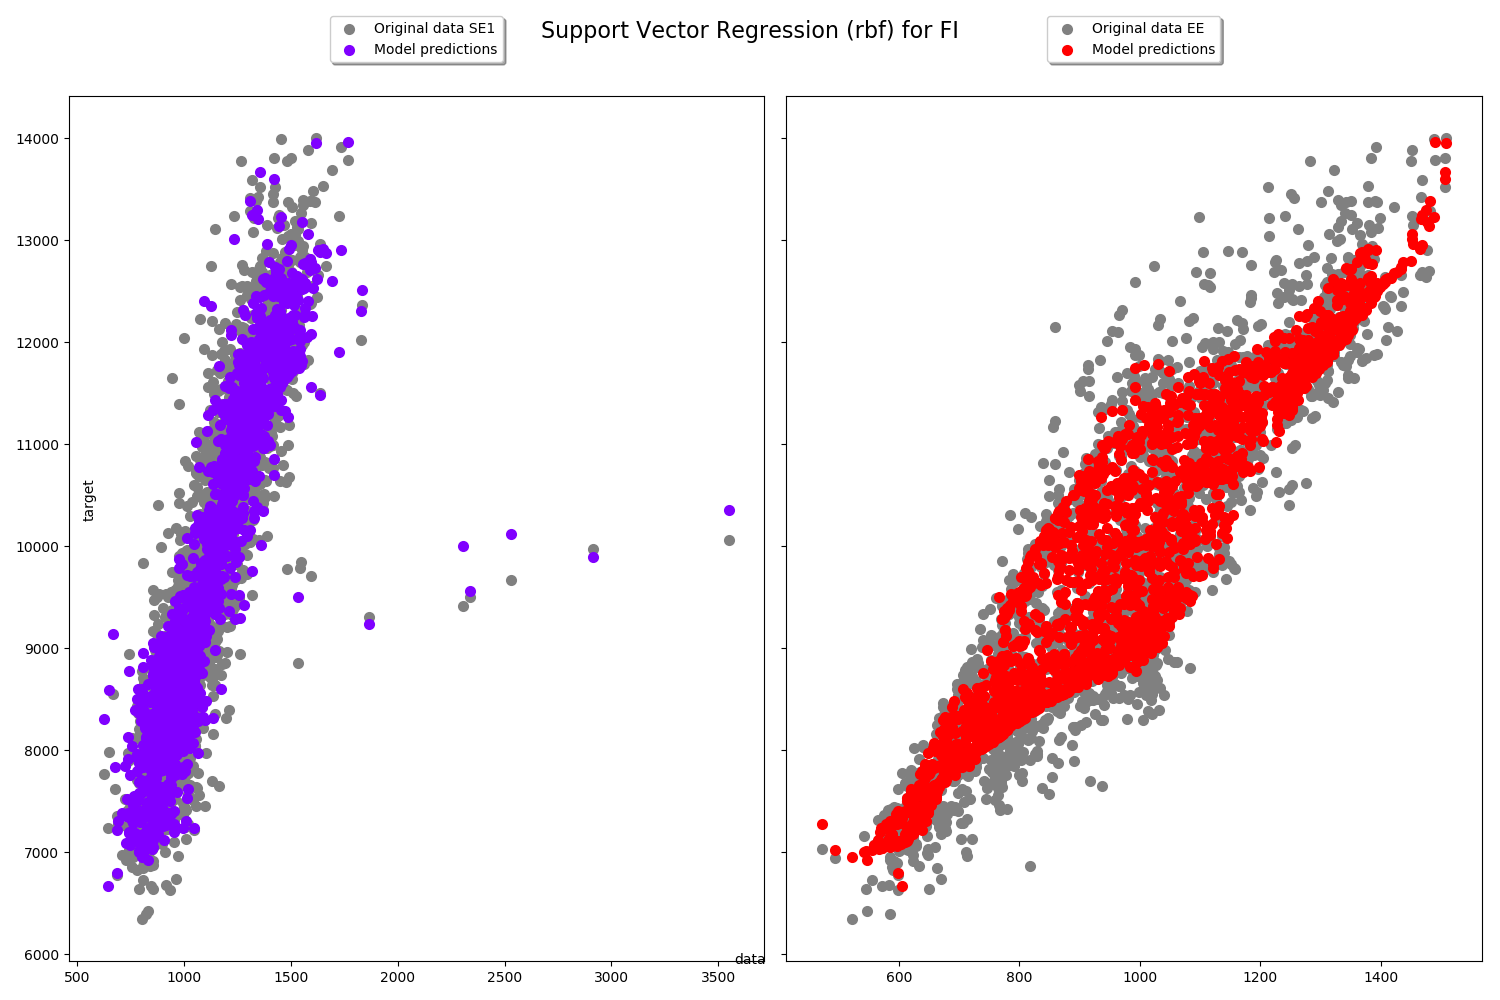
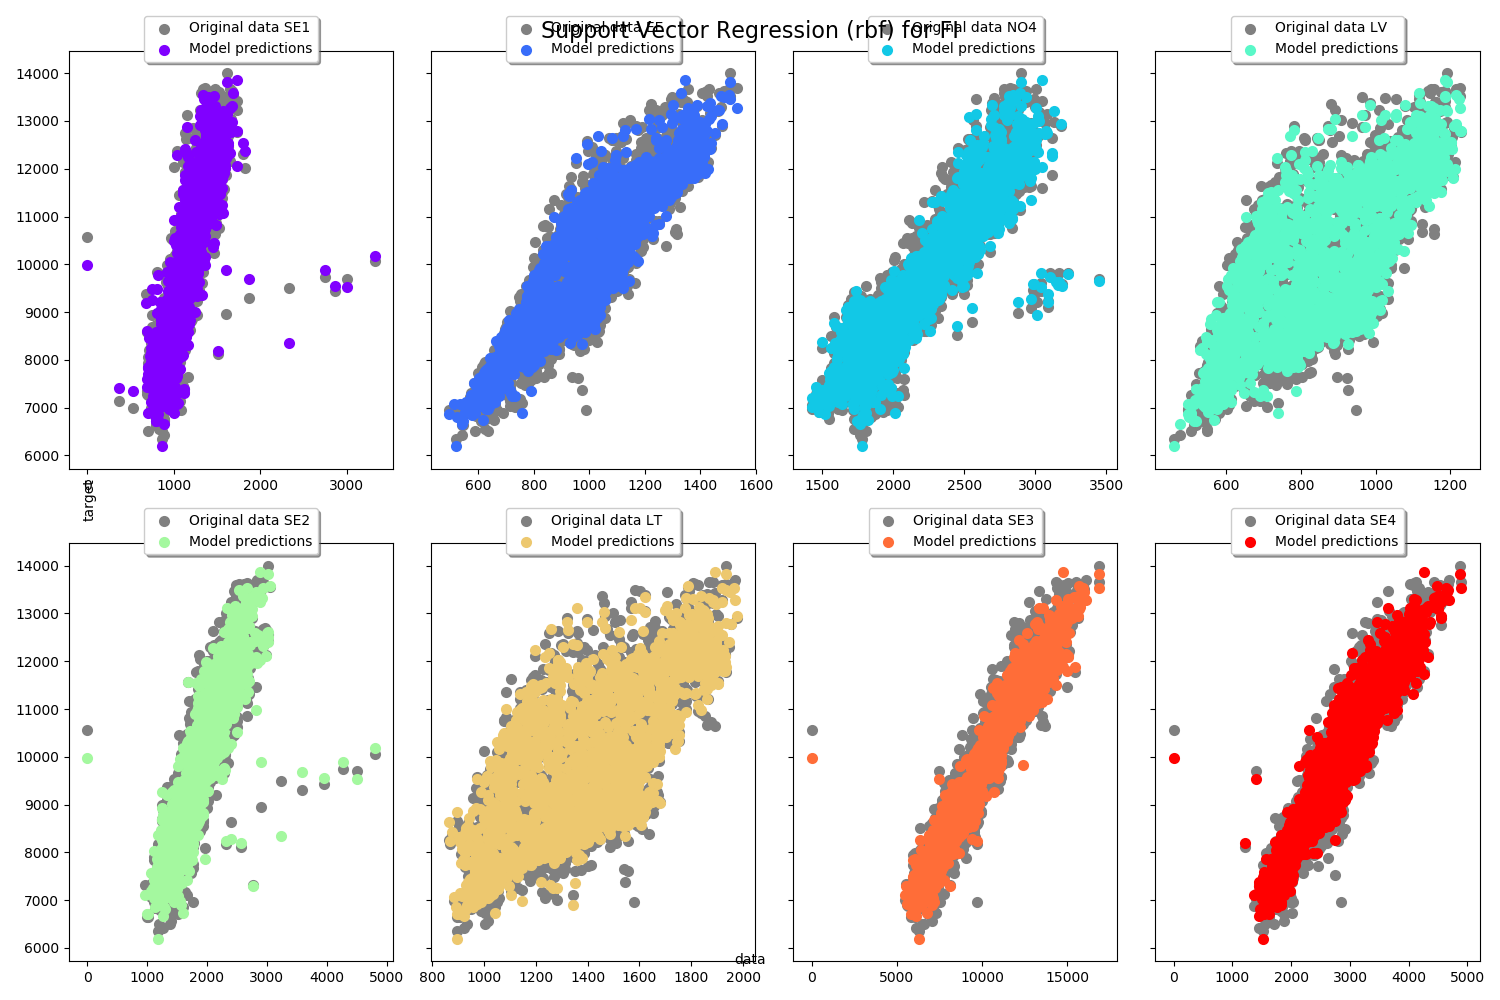
The electricity consumption series of Estonia and Sweden from 2018 were given to the artificial intelligence, allowing it to use them to predict electricity consumption in Finland. Figure 3 shows the actual consumption in Finland in grey and the electricity consumption in Finland predicted by artificial intelligence in colour. The Y axis has Finland’s consumption and the X axis the consumption of the electricity market area SE1 in Northern Sweden and the consumption in Estonia (EE) as explanatory factors. As can be noted, artificial intelligence was able to predict Finland’s electricity consumption surprisingly well using the consumption of neighbouring countries, even though the prediction is not perfect. The figure on the right, in particular, shows that predicting low and high electricity consumption did not work that well.
The accuracy of the prediction can be calculated using the method of least squares, which this way gave a result of 0.896. The perfect prediction accuracy would be 1.0 and the lower the value, the worse the prediction. As a rule of thumb, prediction accuracies falling under 0.5 are almost like throwing darts, and up from there, we go from an educated guess towards a perfect prediction. As a comparison, with traditional methods, we have at best been able to achieve an accuracy of 0.93, which can already be classified as a good prediction. So artificial intelligence remains in second place as of yet.
For machine learning methods, it is important to provide a little too much data rather than too little. So let’s provide more data.
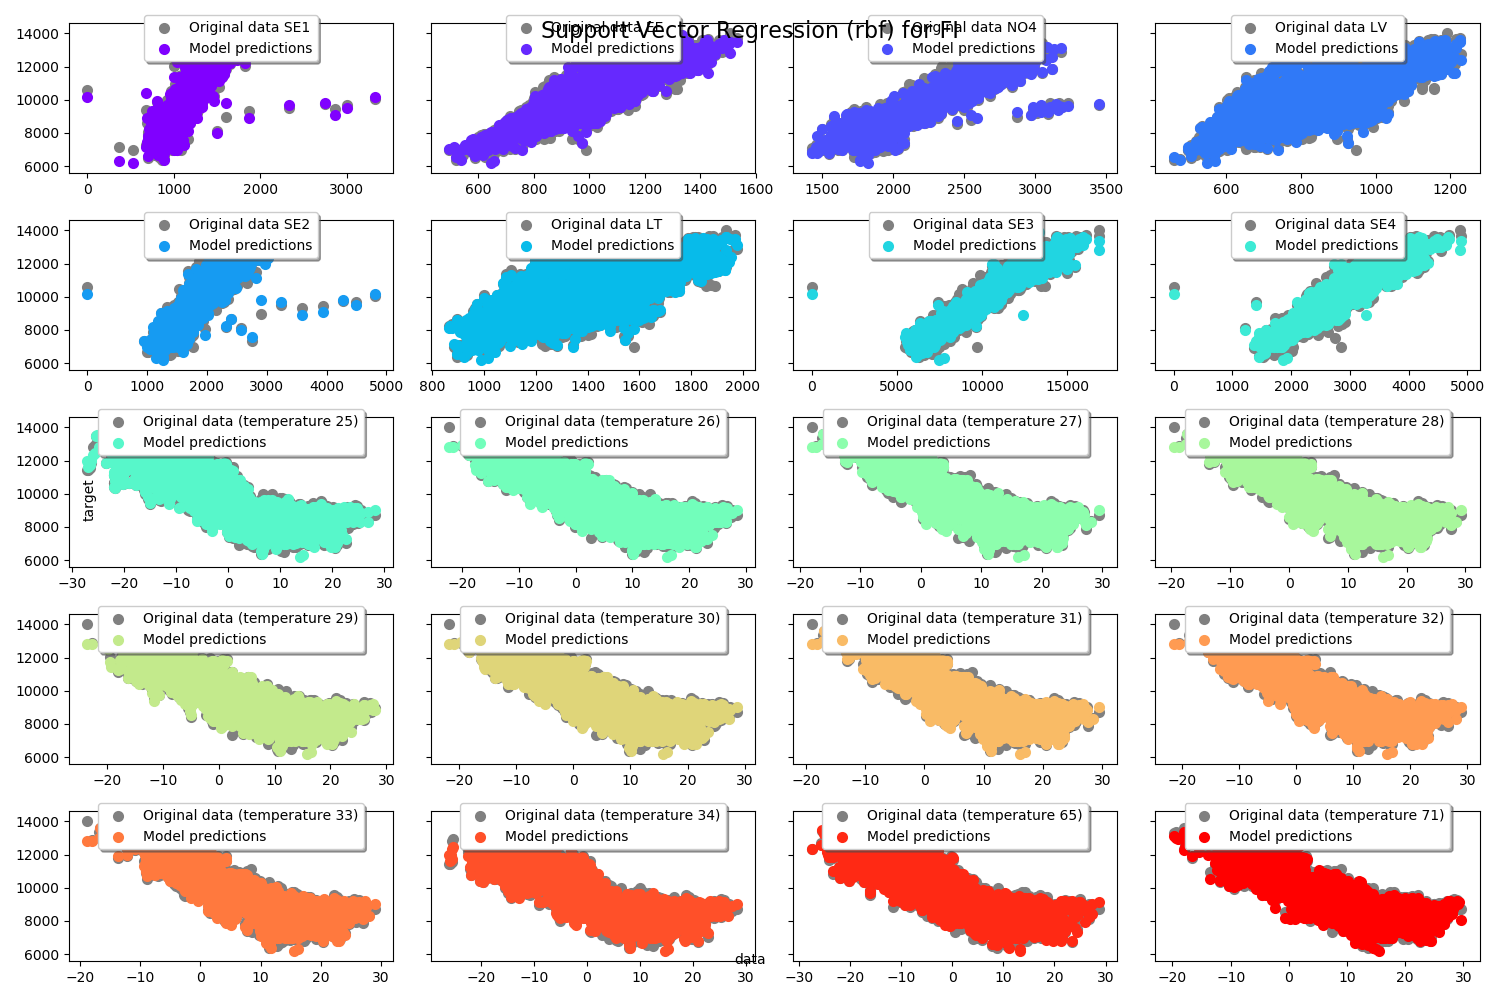
In the second phase, artificial intelligence was provided with the consumption time series of eight nearby electricity market areas in total. This included the consumption series of all Swedish electricity market areas, Estonia, Lithuania, Latvia and one series from Norway.
With time series from eight price areas, the accuracy of the prediction rose to 0.96. The accuracy is clearly better than the 0.93 of traditional methods, and especially for time series, an accuracy of 0.96 is already very good. Providing multiple time series from different areas clearly helps artificial intelligence learn better than with two time series.
Looking at the differences between the predictions and realised points in Figure 4, the majority of the point mass seems to fall into place fairly well. We could already be happy with this accuracy of prediction, but let’s test how good artificial intelligence can become with this method.
Experts have already been defeated, can artificial intelligence outdo itself?
So far, artificial intelligence has only been taught through the electricity consumption of neighbouring countries. In the next phase, artificial intelligence was also provided with temperature series from 12 separate localities in Finland during the same year. The accuracy of the prediction improved even further: 0.975 (Figure 5). Such a high prediction accuracy sounds almost like North Korean statistics to me.
As a final test, artificial intelligence was provided with the electricity consumption series of 24 European electricity market areas and the temperature series of 12 localities in Finland. This included consumption series from Norway, Denmark and various countries in Central Europe, which do not as such sound like terribly significant factors for predicting Finland’s electricity consumption. However, the accuracy of the prediction improved even further to 0.987.
As a result of the market model team test, artificial intelligence beat experts in the prediction accuracy of Finland’s electricity consumption with 0.99 vs. 0.93. What was surprising about the test was that the prediction accuracy of artificial intelligence kept improving when provided with more and more data, even though it was not necessarily even all that relevant anymore from an expert point of view. This may be a reflection of how multidimensional the problem of predicting electricity consumption is, and how difficult it is to identify all the factors that affect it. Perhaps there will be no need to identify them in the future if artificial intelligence will do it for us.
In what other cases could artificial intelligence provide a better prediction than experts?
Jarkko Tulensalo
Specialist, Electricity market at Strategic Grid Planning in Fingrid Oyj